Stadium-by-Stadium Breakdown
Below we analyze each MLB ballpark’s impact on four key pitcher prop categories – Strikeouts, Walks Allowed, Earned Runs, Outs Recorded – using recent data (2024–2025) and expert insights. Favorable means the park tends to help pitchers in that stat (e.g. more strikeouts, fewer walks or runs, more outs), while Unfavorable means it tends to hurt pitchers (e.g. fewer strikeouts, more walks or runs, or quicker hooks). We focus solely on pitching effects (not hitting), and note any significant park changes or wind factors.
AL East
Oriole Park at Camden Yards (Baltimore Orioles): Camden Yards dramatically shifted from a hitter’s haven to a pitcher-friendly park after the left-field wall was moved back in 2022.
Strikeouts: Neutral to slightly favorable. The deeper fences and improved backdrop have marginally helped pitchers miss bats. Camden isn’t among the top K parks, but Orioles pitchers saw improved home strikeout performance post-2022.
Walks: Favorable. With the park playing bigger, pitchers challenge hitters more. There’s less fear of the long ball, leading to slightly lower walk rates at home (attack the zone).
Earned Runs: Very favorable. Once a top-3 hitter’s park, Camden is now closer to neutral or pitcher-friendly (19th in overall park factor by 2022-24). The wall change cut down home runs and run scoring substantially; home ERA dropped almost 1.5 runs for Baltimore after 2022. Pitchers allow fewer runs here than on the road on average.
Outs Recorded: Favorable. The reduced scoring means Baltimore starters can work deeper into games. They aren’t getting knocked out early by big innings as often. Expect pitchers to last longer (more outs) at Camden than in a smaller park.
Yankee Stadium (New York Yankees): Yankee Stadium is known for its short right-field porch boosting home runs, but it has some pitcher-friendly quirks as well.
Strikeouts: Favorable, somewhat surprisingly. Despite being homer-friendly, it ranked among the higher strikeout park factors in recent years. Pitchers (both Yankees and visitors) generate plenty of Ks – possibly because hitters swing for the fences in this park, leading to more whiffs.
Walks: Neutral. The environment doesn’t drastically alter walk rates. Power threats like Judge may get intentionally pitched around (raising walks), but overall pitchers also tend to attack with strikeouts. These effects balance out to around league-average walk rates at Yankee Stadium.
Earned Runs: Unfavorable. It’s a hitter’s park for scoring. The cozy dimensions (particularly to right field) and lower air density in summer boost offense. Even with high strikeouts, mistakes fly out for homers. Pitchers’ ERAs are usually higher at Yankee Stadium (run park factor typically above 1.00).
Outs Recorded: Unfavorable. More runs and homer-fueled rallies mean pitchers often get lifted earlier. It’s harder for a starter to go 6+ innings if a couple of cheap homers put up runs. So, outs recorded props trend lower here (pitchers may not last as long).
Fenway Park (Boston Red Sox): Fenway is an extreme hitter’s park for batting average (thanks to the Green Monster and expansive outfield), which presents mixed results for pitchers.
Strikeouts: Neutral. Boston doesn’t markedly boost or suppress Ks. While hitters put a lot of balls in play off the Monster (reducing strikeouts somewhat), pitchers also aren’t afraid to pound the zone (knowing many fly balls turn into doubles off the wall instead of homers). Net effect: league-average strikeout rates.
Walks: Favorable. Fenway’s spacious foul territory and the tendency for hitters to be aggressive (trying to pepper the Monster or pull over Pesky’s Pole) lead to slightly fewer walks. Pitchers can throw strikes and let the park’s quirks yield outs, rather than nibbling.
Earned Runs: Unfavorable. Overall run scoring is elevated. While not a home run park (Fenway boosts doubles more than HR), it still increases total runs (park factor ~1.06 in recent years) by turning otherwise routine outs into hits off the wall. Pitchers’ ERAs suffer at Fenway due to the high number of hits allowed.
Outs Recorded: Neutral to unfavorable. High pitch counts from many hits (and long innings) can limit how deep starters go. However, if a pitcher induces a lot of grounders, they can survive. On average, expect a bit shorter outings in Fenway because of the stress on pitchers (fewer 1-2-3 innings).
Tropicana Field (Tampa Bay Rays): Tropicana is one of the most pitcher-friendly environments in MLB. It’s a fixed-roof dome with no wind and a batter’s eye that hitters often complain about.
Strikeouts: Very favorable. Trop has an elevated strikeout park factor – top 5 in MLB. Over the last few seasons it boosted Ks by roughly 11%, the highest of any park. The backdrop and lighting make it hard to pick up the ball, leading to more whiffs. Rays pitchers (and their opponents) rack up strikeouts at Tropicana.
Walks: Neutral. The dome conditions provide a consistent strike zone environment. Pitchers are comfortable, but hitters also may be more passive if they aren’t seeing the ball well (could increase walks). These influences even out. Walk rates at Trop are around average.
Earned Runs: Very favorable. Tropicana suppresses offense substantially – roughly 9% fewer runs than average. No weather, spacious foul ground, and fair dimensions all contribute. It’s hard to score runs here. Pitchers’ ERAs tend to be lower at home; Trop is a true pitchers’ park (few homers, lots of low-scoring games).
Outs Recorded: Favorable. Fewer runs and rallies mean pitchers last longer. It’s common for Rays starters (or bulk relievers) to work deeper at home since they aren’t chased by offense. Plus, no risk of rain delays in the dome ensures pitchers’ outings aren’t cut short unexpectedly.
Note: In 2025 the Rays are temporarily playing home games at George M. Steinbrenner Field (outdoors in Tampa) due to Tropicana damage. Early reports suggest that venue will be more hitter-friendly (Yankee Stadium dimensions and warm weather), so Rays pitchers could see a spike in runs allowed and a drop in Ks at home in 2025.
Rogers Centre (Toronto Blue Jays): Rogers Centre underwent renovations in 2023 that altered its outfield dimensions, generally making parts of the park smaller (especially power alleys).
Strikeouts: Neutral. Toronto’s dome doesn’t create an unusual strikeout environment; it sits around league average for Ks. The changes in field dimensions haven’t visibly impacted strikeout rates – pitchers neither gain nor lose an edge here in terms of Ks.
Walks: Neutral. No significant park-induced effect on walks. The dome and turf yield true hops and consistent conditions, so walk rates mostly depend on the pitchers and hitters involved rather than the stadium.
Earned Runs: Unfavorable (trending more so after renovations). Historically Rogers was neutral, but the 2023 fence adjustments led to a homer surge. By 2024 it was playing as a hitter’s park for home runs and run scoring. Pitchers now face a park factor slightly above 1.00 for runs – more balls leaving the yard or finding the seats in the new bullpen areas. Expect a higher ERA at Rogers than on the road if the trend holds.
Outs Recorded: Unfavorable. With added offense (especially via home runs), Blue Jays starters have had shorter outings at home post-renovation. It’s harder to go 6-7 innings clean when a routine fly ball might sail out in the newly configured field. Opposing pitchers also often get a quick hook if the Toronto lineup capitalizes on the park’s friendly dimensions.
AL Central
Guaranteed Rate Field (Chicago White Sox): This park is known for home runs (especially in summer heat on the South Side), but it also has a sneaky-tough batter’s eye.
Strikeouts: Neutral overall. Statcast shows Chicago’s South Side park as roughly average (K factor ~102). Interestingly, four-seam fastballs get an outsized whiff rate here (22.5% whiff, one of the highest), possibly due to a deceptive batter’s eye that ranks among MLB’s hardest to see pitches. So pitchers with good heaters can rack up Ks at home. But breaking/offspeed results are more ordinary, keeping total Ks around normal.
Walks: Neutral to slightly unfavorable. The small dimensions (short fences) can cause pitchers to nibble, leading to a bit more caution. That can translate to a few extra walks allowed, especially in high home-run threat situations. However, White Sox pitchers also tend to attack at home to leverage that fastball whiff edge. Net effect is close to average walks, maybe a tick higher when weather is hot (ball flies farther, inducing cautious pitching).
Earned Runs: Unfavorable. It’s a hitter-friendly park for scoring. The combination of a hitter-favored backdrop for contact (aside from the fastball issue) and homer-friendly lines/gaps (especially to right-center) means higher run environment. In the past five seasons it has played as a slight hitters’ park in terms of runs. Expect ERAs to be a bit inflated at home, especially in summer when the ball carries.
Outs Recorded: Unfavorable. More runs and frequent home runs mean fewer deep outings. Starters often get chased by the 5th or 6th inning if a couple long balls put up a crooked number. Unless a pitcher is dominant, it’s tough to consistently log 18+ outs in this park.
Progressive Field (Cleveland Guardians): A fairly neutral park with some pitcher-friendly aspects (deep fences in parts of the outfield) and some hitter-friendly ones (shorter to right).
Strikeouts: Neutral. Cleveland doesn’t significantly alter strikeout totals. It’s not noted for a tough batter’s eye or extreme conditions. One subtle point: breaking balls get slightly fewer whiffs here (one of the lowest swinging-miss rates on breakers at ~27.7%), but that hasn’t made a large dent in overall Ks. Expect standard strikeout numbers.
Walks: Neutral. No strong tendency to increase or decrease walks. The park size gives pitchers moderate confidence to throw strikes (suppressing walks), but the Guardians also cultivate contact hitters, which can draw out at-bats and occasional walks. These factors essentially cancel out.
Earned Runs: Neutral to slightly favorable. Progressive Field suppresses home runs (it had one of MLB’s lowest HR park factors ~0.82 in recent years), which helps keep run scoring in check. Overall run factor has been just below average. Pitchers generally benefit in ERA a bit – fewer cheap homers means you often give up a long double instead of a 2-run shot. That said, it’s not as suppressive as the true pitcher parks. Call it mildly pitcher-friendly for runs allowed.
Outs Recorded: Favorable. The relatively spacious field and lack of constant onslaught of runs allow pitchers to work deeper. Cleveland’s staff, in particular, has taken advantage by pitching to contact and going longer in games at home. Look for slightly longer outings (more outs) at Progressive than in smaller AL Central parks.
Comerica Park (Detroit Tigers): A traditionally pitcher-friendly park, Comerica has huge dimensions, though some walls were brought in a bit for 2023.
Strikeouts: Neutral. Despite being large, Comerica doesn’t boost Ks much – big outfield means hitters put balls in play that would be outs (flyouts) rather than striking out. Pitchers don’t need to K everyone when the park will hold many flies. On the flip side, early in the season cold weather can make hitting tougher, possibly bumping up Ks slightly. Overall it evens out.
Walks: Favorable. The lack of home run threat in vast Comerica gives pitchers confidence to attack hitters. There’s less incentive to pitch around guys when a blast that’s a homer elsewhere might be a harmless double here. Tigers pitchers tend to issue fewer walks at home, and opponents likewise challenge Detroit’s lineup.
Earned Runs: Favorable. Even after modest fence adjustments, Comerica remains a pitcher’s park. It was among the most run-suppressing parks at times (often around 5–10% below average run scoring). Fewer homers and a lot of area for outfielders to cover (turning would-be extra-base hits into outs sometimes) keep ERAs down. Pitchers usually enjoy a lower ERA at home in Detroit than on the road.
Outs Recorded: Favorable. Lower run scoring and fewer big innings mean pitchers last longer. It’s not uncommon to see Tigers starters work deep into the 7th in Comerica when they might be gone by the 5th in a smaller park. The park’s spaciousness also yields more foul outs and easy fly outs, stealing quick outs and helping pitchers go deep.
Kauffman Stadium (Kansas City Royals): A paradoxical park: extremely spacious outfield (few homers) but very hitter-friendly for batting average and runs.
Strikeouts: Unfavorable. Kauffman is the toughest park for strikeouts in recent years. It has decreased Ks by an MLB-high ~13% over the last three seasons. The backdrop and huge field encourage contact – hitters see the ball well and know the park will reward ball-in-play. Pitchers miss fewer bats here than anywhere; Kauffman had one of the lowest fastball whiff rates at 17.1% (bottom 5). So strikeout props trend under at Kauffman.
Walks: Favorable. Pitchers aren’t afraid to throw strikes in Kansas City. With the deep fences, they challenge hitters – better to give up a long fly (likely an out or double at worst) than a free pass. Thus, walks are relatively suppressed (more so than average) in this park. Expect lower walk totals; Royals pitchers historically have a lower BB rate at home.
Earned Runs: Unfavorable. Despite limiting homers, Kauffman actually boosts run scoring via hits. It plays like a hitter’s park for overall runs – essentially on par with Coors Field and Great American Ball Park in recent run environment. The vast outfield yields lots of singles, doubles, and triples falling in. Pitchers often get BABIP’ed to death here. A modest fly ball that would be an out elsewhere might drop between fielders for a hit. The result: higher ERAs at home; it’s a difficult park to keep runs off the board, just in a different way than a small homer haven.
Outs Recorded: Unfavorable. The high hit rate can drive up pitch counts and big innings, pulling pitchers early. Even though homers are rare, starters can get knocked out by a parade of doubles and bloopers. It’s hard to go deep when every inning you’re dealing with traffic on the bases. So, pitchers generally log fewer outs per start in Kansas City. (One silver lining: the huge foul ground at Kauffman can create a few extra foul-pop outs, slightly offsetting the hit barrage.)
Target Field (Minnesota Twins): A modern park that is pretty balanced after some tweaks. Target Field is not extreme in any direction, though weather can swing it (cold springs vs warm summers).
Strikeouts: Neutral. Minnesota doesn’t significantly alter strikeout numbers. Any given game’s Ks depend more on the pitchers than the park. There’s no notable backdrop issue; however, cooler temperatures in April can give pitchers an edge (stiffer bats, ball doesn’t travel, which can indirectly lead to more swings and misses). In the heat of summer, it’s standard. Net-net, expect league-average K rates.
Walks: Neutral. No strong park effect on walks. Target Field’s dimensions are fair, so pitchers don’t dramatically change their approach. They might be a tad careful to right field (where it’s shorter), but not enough to spike walks. Overall, walk props neither get a boost nor a cut here.
Earned Runs: Neutral. It sits in the middle of the pack for run factor most years. After opening as a pitcher’s park in 2010, adjustments (like warming climate and possibly some minor fence changes) have made it play closer to average. In 2024 it wasn’t among top 5 in either extreme. A slight lean: in cold weather it suppresses runs, in midsummer it can play hitter-friendly on some days. Those balance out. Pitchers’ ERAs at Target are typically similar to their road ERAs.
Outs Recorded: Neutral. Because run conditions are moderate, there isn’t a systemic push one way or the other on how long pitchers last. Twins starters can go deep if pitching well, or get knocked out if struggling – just like they would in a neutral context. There’s no persistent factor forcing early hooks (like Coors’ offense or Tampa’s rotation strategies). So expect average outing lengths.
AL West
Minute Maid Park (Houston Astros): A park of contrasts – short porch in left and quirky dimensions yield some cheap homers, but a huge center field and humid air can suppress other hits.
Strikeouts: Neutral. Houston’s park doesn’t significantly affect K totals. The batter’s eye is decent (a dark restaurant in CF) and when the roof is closed, conditions are consistent. Astros pitchers historically post similar strikeout rates home and away. There’s a balance: hitters aggressive for that LF porch might K a bit more, but overall nothing extraordinary.
Walks: Neutral. One might expect more walks due to the Crawford Boxes in left (pitchers might pitch around right-handed sluggers). While that happens occasionally, Houston’s staff also tends to pound the zone at home, trusting their stuff. The result is an average walk rate environment. No big prop edge on walks allowed in either direction.
Earned Runs: Neutral. Minute Maid is around average for run scoring, perhaps slightly unfavorable (a touch hitter-friendly) depending on the year. It giveth and taketh – some fly balls that are routine outs elsewhere become homers down the lines (bad for ERA), but the deep power alleys and center field squash many would-be extra-base hits (good for ERA). Statcast in 2023 showed it middle-of-the-pack for overall run factor. Pitchers might see a few more solo homers, but not a huge swing in total runs allowed.
Outs Recorded: Neutral. Since run environment is normal, pitchers’ ability to go deep is mostly determined by their own effectiveness. An efficient pitcher can throw a quality start in Houston as easily as anywhere. If anything, Houston’s roof can be closed to mitigate extreme heat, meaning less pitcher fatigue on hot days, but that’s a minor advantage. Generally, no consistent bias in how long pitchers last.
Angel Stadium (Los Angeles Angels): A pitcher-friendly park that became slightly more hitter-friendly after lowering the right-field wall in 2018. Still, marine layer nights help keep it a bit in pitchers’ favor.
Strikeouts: Favorable. Angel Stadium shows a modest boost in swing-and-miss, especially on breaking balls. It ranked #2 in MLB for breaking-ball whiff rate (33.5%) from 2021-23. That suggests a backdrop or air effect aiding pitch movement at night. Overall K factor is a tad above average. Pitchers like Ohtani and co. have notched healthy strikeout totals at home.
Walks: Neutral. Split data by handedness once showed LHB walks at 95 and RHB at 105 (index), canceling out to about 100 overall. In practice, nothing extreme happens with walks here. Pitchers aren’t exceptionally wild or pinpoint just because of the park.
Earned Runs: Favorable. Angel Stadium tends to suppress run scoring. In the past it has been bottom-10 in run factor (e.g. 0.95 or so). The roomy left-center, high wall in right-center, and heavy night air all work in pitchers’ favor. Home ERAs for Angels pitchers are usually lower than road. While the 2018 fence lowering added a few more HR for lefty hitters, it’s still not a hitter’s paradise. Overall, consider it pitcher-friendly for preventing runs.
Outs Recorded: Favorable. With lower scoring and a pitcher-friendly environment, starters often pitch deeper into games. They can trust the park to hold flies and thus pitch to contact more, leading to quicker outs. We see a fair number of 7-inning outings in Anaheim, especially in cooler night games where offense is muted.
Oakland Coliseum (Oakland Athletics – through 2024): The Coliseum has long been one of the most pitcher-friendly parks in baseball. It’s extremely spacious in foul territory and outfield, with heavy night air off the bay. (In 2025, the A’s move to Sutter Health Park in Sacramento; see note below.)
Strikeouts: Neutral to slightly unfavorable. Oddly, despite its pitcher-friendly rep, Oakland doesn’t boost Ks; it may even suppress them a bit. Reason: the enormous foul territory generates a lot of foul-pop outs that elsewhere would just be strikes extending an at-bat. Those extra foul outs effectively replace some strikeouts with outs in play. So pitchers still get outs (good) but not via the K. Oakland’s strikeout park factor was around average or just below.
Walks: Favorable. Pitchers attack the zone in Oakland. With the cavernous dimensions, there’s little penalty for challenging hitters. Walk rates tend to be low; A’s pitchers historically walked fewer at home. Also, foul territory means hitters can’t afford to be too passive (a foul ball might be caught for an out), which can keep walk totals down.
Earned Runs: Very favorable. The Coliseum depresses offense significantly. Few parks yield fewer runs. Homers are hard to come by in the marine air (especially at night), and many fly balls and fouls turn into outs. Oakland consistently ranked among the lowest run-scoring environments (often 10%+ below average in runs). Pitchers thrive here, posting much lower ERAs at home.
Outs Recorded: Very favorable. Everything about this park helps pitchers go deeper: extra foul outs (Oakland had 162 outs via foul balls in 2023, 44 more than an average park), fewer hits allowed, and fewer runs to prompt a pitching change. Even average starters often get through 6+ innings at home. It’s an excellent park for “outs recorded” overs, as managers let their pitchers ride a bit longer in the friendly confines.
Note: Sutter Health Park (Sacramento) will host A’s games in 2025. It’s expected to be more hitter-friendly than Oakland (smaller foul ground and warmer weather). That likely means a spike in runs allowed (less favorable ERA) and a slight drop in outs recorded as pitchers deal with tougher conditions. The extreme foul-pop advantage will disappear, so A’s pitchers might lose a few outs they used to get easily.
T-Mobile Park (Seattle Mariners): One of MLB’s most pitcher-friendly parks in recent seasons, with a marine layer and a notorious backdrop that elevates strikeouts.
Strikeouts: Very favorable. Seattle may be the “ultimate pitcher’s park” for Ks and run prevention. It consistently ranks at or near the top for strikeout park factor (~108 index, meaning ~8% more Ks). Over 2021-23 it had one of the highest K environments (whiff rate ~22.5%). The batter’s eye and background lighting at T-Mobile (formerly Safeco) seem to impair hitters’ vision, generating lots of swings and misses (Mariners pitchers like Castillo and Kirby have notably higher strikeout rates at home).
Walks: Favorable. Statcast data shows Seattle with a below-average walk factor (~96). Pitchers are comfortable challenging hitters here, and hitters, struggling to see the ball well, often fall behind rather than drawing walks. So free passes are relatively scarce.
Earned Runs: Very favorable. T-Mobile is a run suppressor. In fact, it had the lowest run park factor in MLB going into 2025 (even lower than Petco), reducing scoring by around 10–15%. The cool, dense air (especially at night) knocks down fly balls. Even with the fences brought in a bit over the years, it’s tough to score big here. Pitchers typically enjoy significantly better run prevention at home in Seattle.
Outs Recorded: Favorable. The combination of more Ks, fewer walks, and less offense means pitchers last longer. Mariner starters often work deep into games at home. It’s common to see higher pitch counts (because they’re mowing batters down) yet still low stress. Unless pitch count gets exorbitant due to strikeouts, a Seattle starter can often clear 18–21 outs if pitching effectively. The park rarely forces an early exit.
Globe Life Field (Texas Rangers): A new retractable-roof stadium (opened 2020) that plays much differently than the old Arlington ballpark. Globe Life Field leans neutral or slightly pitcher-friendly, with the roof mitigating the brutal Texas weather.
Strikeouts: Neutral. No strong evidence of Globe Life Field altering strikeout totals. The climate-controlled environment (when roof closed) and a large-ish outfield don’t push Ks one way or another significantly. Rangers pitchers’ K rates home vs away have been similar.
Walks: Neutral. Again, fairly standard. The park itself isn’t driving changes in walk behavior. It’s not extremely small (which might cause nibbling) nor extremely large (which would encourage attacks). Thus, walk rates hover around average.
Earned Runs: Neutral. In its short history, Globe Life Field has played close to neutral for runs. Initially it was thought to be pitcher-friendly (in 2020 it suppressed offense a lot), but as more data came in with fans in attendance and open/closed roof variations, it evened out. By 2024 it was not in the top or bottom tier of run factors. It’s certainly far less hitter-friendly than the old Rangers Ballpark – summer games no longer automatically turn into slugfests under 100°F heat, since they can close the roof. Overall, pitchers don’t get a huge boost, but they also aren’t as terrorized as they were in Arlington.
Outs Recorded: Neutral. Given the balanced run environment, pitcher outings depend on performance. There’s no consistent extra help or harm. The roof does prevent weather-related short outings (no sudden rain delays or extreme heat fatigue), which might marginally help pitchers last, but that’s situational. In general, expect average length starts.
NL East
Truist Park (Atlanta Braves): A relatively new park (2017) that has played as moderately hitter-friendly for power, but it has an odd trend of boosting strikeouts.
Strikeouts: Favorable. Truist Park shows up in analyses as a strikeout-friendly venue. It was a surprising top-5 strikeout environment from 2021-23. Notably, it led MLB in breaking-ball whiff rate (35.1%) – pitchers get a ton of swing-and-miss on sliders/curves here. Possibly the batter’s eye or lighting in Atlanta contributes to that. So despite all the Braves’ offensive fireworks, pitchers do rack up Ks at Truist.
Walks: Neutral. There isn’t a clear park effect on walks in Atlanta. Braves pitchers are generally around league average in walk rate at home. While the park’s propensity for homers (especially to right field) might cause a tad more nibbling, the team’s pitching philosophy and quality mitigate that. Call it essentially neutral for walks allowed.
Earned Runs: Neutral. Truist is somewhat hitter-friendly for homers (shorter to LF and power alley), but overall run scoring isn’t extreme. After its first few years, it profiles close to neutral for runs (around 1.00 park factor). Braves’ strong offense can make any game high-scoring, but strictly park-wise, a decent pitcher can put up a normal ERA here. It’s not as pitcher-friendly as Turner Field was, but also not a bandbox.
Outs Recorded: Neutral. With only a slight lean toward offense, pitchers can still go deep if they’re dealing. Atlanta’s starters like Fried or Strider often pitch efficiently at home. Unless the opponent’s offense knocks them out, they can complete 6-7 innings. Essentially, Truist doesn’t inherently limit pitcher longevity outside of normal game flow.
LoanDepot Park (Miami Marlins): Once a pitcher’s paradise, Miami’s park has become more neutral or even hitter-friendly after various adjustments (fences moved in, roof open more often, etc.).
Strikeouts: Favorable. One thing that has remained is a good strikeout environment. LoanDepot Park was top-tier in generating swing-and-miss on breaking balls (32.8% whiff, among the highest). Overall K rates are solid here; Marlins pitchers (e.g. Jesús Luzardo, Alcantara) have enjoyed strong home strikeout numbers. The air-conditioned, consistent conditions and a decent batter’s eye help sharp breaking pitches bite and get whiffs.
Walks: Neutral. Miami doesn’t exhibit a strong walk factor bias. In the early days, the vast outfield encouraged attacking hitters (low walks), but as the park has evened out, walk rates have normalized. Pitchers nowadays treat it like an average park in terms of strike zone approach.
Earned Runs: **Neutral to unfavorable (recently). Historically very pitcher-friendly, Miami’s park factor for runs has jumped. In fact, by 2024 it became one of the higher-scoring parks (second-highest run factor in MLB). The combination of moving walls and perhaps changes in weather/roof usage led to more offense – more homers than before and generally more runs. So whereas a few years ago it was strongly favorable for ERA, it’s now closer to neutral or even a bit hitter-leaning. Pitchers can no longer count on Miami to hide their mistakes; home ERAs aren’t as depressed as they used to be.
Outs Recorded: Neutral. With the park playing closer to average for run scoring, pitchers’ ability to go deep is about the same as elsewhere. If anything, the increase in offense has made Marlins pitchers slightly less likely to finish 7+ innings at home than before. But they still benefit from no rain interruptions (roof) and a forgiving outfield for deep flies, which can help keep them in games. On balance, it’s average for outs now.
Citi Field (New York Mets): A pitcher-friendly park, especially after its early extreme dimensions were tempered by moving the fences in (twice). Still, it suppresses offense more often than not.
Strikeouts: Favorable. Citi Field can boost strikeouts a bit. It has a spacious field and historically a dark batter’s eye that gives hitters some trouble, particularly in day games. While not as pronounced as Seattle or Tampa, pitchers tend to post slightly higher K rates at Citi. The environment encourages challenging hitters (who then often have to swing through good pitches).
Walks: Favorable. Mets pitchers typically walk fewer at home. The park’s size (deep gaps) means pitchers aren’t as afraid of hard contact – they’d rather attack than give a free pass. Additionally, hitters can get frustrated at Citi (big field knocking down would-be homers), which might make them more aggressive, leading to fewer walks. Overall, walk allowed props lean under in New York.
Earned Runs: Very favorable. Citi Field consistently suppresses run scoring (recent run park factor around 0.87–0.91). In 2024 it was among the most run-suppressing parks. Home runs are harder to come by (especially in center/right-center), and the heavy air at night keeps the ball in the park. Mets pitchers usually have significantly better ERAs at home. Bettors often look to unders for earned run props at Citi, as it’s tough to score big (unless weather is unusually hot/windy).
Outs Recorded: Favorable. The pitcher-friendly conditions allow for longer outings. New York starters can pitch deeper into games at Citi Field because they’re not as quickly punished for mistakes. We see plenty of 7-inning outings when deGrom/Scherzer (previously) or others are cruising at home with low run support needed. The park helps keep pitch counts manageable (fewer hits/walks per inning), aiding overs on outs recorded.
Citizens Bank Park (Philadelphia Phillies): A well-known hitters’ park, especially for home runs. It’s relatively small and can be a nightmare for pitchers when the ball is flying.
Strikeouts: Neutral. Philadelphia’s effect on Ks isn’t extreme. While one might think hitters swinging for the fences could K more, the park’s boost to offense mostly comes from balls in play leaving the yard, not from altering contact rates. Phillies pitchers with strikeout stuff still get their Ks at home, and contact-oriented pitchers still pitch to contact. On balance, strikeout totals come out about average in Philly.
Walks: Unfavorable. The threat of big homers in this park can make pitchers nibble. It’s not a huge increase, but there’s a tendency to pitch carefully, especially to power lefties (given the short right field). That can lead to a few extra walks. The park’s reputation can get into a pitcher’s mind – better to issue a walk than give up a bomb. So we often see slightly elevated walk rates in Citizens Bank Park.
Earned Runs: Unfavorable. This is a hitters’ park for runs. The run factor has been consistently above 1.05 in recent years. It’s “quietly one of the league’s most homer-happy parks”, which directly translates to more runs allowed. Pitchers often struggle to keep the ball in the yard (especially on warm summer nights), inflating ERAs. Expect higher earned run props – Philly is a park where even aces can give up 3-4 runs in a quality start.
Outs Recorded: Unfavorable. Because of the heightened offense, starters often can’t last as long. A couple of home runs or big innings will get a pitcher pulled in the 5th or 6th. Unless they’re mowing hitters down, the leash might be shorter at home, where one swing can quickly change the game. As a result, pitchers log fewer outs on average in Philadelphia than they would in a more forgiving park.
Nationals Park (Washington Nationals): An underrated hitter’s park in certain aspects, with symmetrical dimensions and often humid summers that carry the ball. It’s been quite friendly to hitters lately, especially left-handed hitters.
Strikeouts: Unfavorable. Nationals Park has been suppressing strikeouts significantly. In fact, it led MLB in strikeout reduction for left-handed batters – about an 18% drop in Ks vs. averageaol.co.uk. Overall K rates are on the lower side here, making it a tough place for pitchers to hit their strikeout prop overs. The background and comfort for hitters (no tricky batter’s eye issues) means more contact. Pitchers generally see a dip in K% in D.C.
Walks: Neutral. There isn’t a strong park-driven trend for walks. While a contact-friendly park can sometimes mean pitchers throw more strikes (to avoid free passes), Nationals Park also has enough pop (especially in hot weather) that pitchers might pitch around certain hitters. These tendencies even out. We typically see league-average walk rates in Washington.
Earned Runs: Unfavorable. Washington has played as a hitter’s park in recent seasons. It boosts offense across the board. For example, it’s considered a top hitters’ park for lefty power (plenty of pull-side homers). The park factor for runs has been above 1.00. Nationals Park’s spacious gaps and summer air help the ball travel – not to mention the often mediocre Nationals pitching contributes to high scoring games at home. Pitchers’ ERAs inflate here; it’s not a venue conducive to low-run outings.
Outs Recorded: Unfavorable. Because strikeouts are harder to come by and hits come easier, pitchers labor more and exit earlier. Nationals starters and opponents alike often have trouble completing 6 innings without damage. Unless facing a weak lineup, it’s tough to log a lot of outs in D.C. before the bullpen is needed. High pitch counts from many balls in play (and runs) limit how deep starters go.
NL Central
Wrigley Field (Chicago Cubs): Wrigley is unique – its characteristics can flip dramatically with the wind. Overall, it’s around neutral on average, but any given day can skew pitcher-friendly or hitter-friendly.
Strikeouts: Neutral (with high variability). On a calm or wind-in day, strikeouts can be plentiful as the dense air and background favor pitchers somewhat. When the wind is blowing out hard, pitchers often pitch to contact (and hitters swing for contact), so K numbers might drop. Over a season these effects average out. Wrigley doesn’t inherently boost or cut Ks aside from wind influence.
Walks: Neutral. Again, it depends on conditions: wind out might make pitchers nibble (increasing walks), wind in they attack (decreasing walks). The Cubs’ staff typically has league-average walk rates at home. No persistent significant bias, just day-to-day adjustments.
Earned Runs: **Neutral on average, but extremely variable. Some days Wrigley is one of the toughest parks to score (wind howling in from Lake Michigan, knocking everything down – those days play very pitcher-friendly). Other days the wind blows out and it becomes a bandbox where ERAs explode. In 2024, interestingly, Wrigley ended up suppressing runs by over 10% (third-lowest run factor), likely due to many wind-in games. But bettors know to always check the wind: a 10 mph breeze out to left or right can turn a pitcher’s outing ugly (many runs), whereas a stiff wind in from center makes for a favorable low-run game. So, earned runs at Wrigley are highly context-dependent.
Outs Recorded: Neutral overall. When conditions are pitcher-friendly, starters cruise and rack up outs (often going 7+ with ease if efficient). When the wind is against them, they might get yanked early. The net effect is average. One note: day games after night games, or hot humid afternoons, can tax pitchers differently (Wrigley is one of the few parks with a lot of day games). Fatigue in heat could shorten outings, but managers are aware and plan for it. On the whole, there isn’t a consistent lean without specifying wind.
Great American Ball Park (Cincinnati Reds): One of the premier hitter’s parks. It’s small, the ball flies, and pitchers often suffer.
Strikeouts: Neutral. The park’s impact on Ks isn’t as famous as its home run impact. Pitchers do sometimes get more strikeouts by necessity (since any ball in play can be trouble, they may go for Ks). Meanwhile, hitters in Cincinnati are aggressive, looking to do damage, which can either result in quick outs or big hits rather than deep counts. Net result: strikeout totals end up about normal. High power, high strikeout hitters thrive here, so pitchers face their usual outcomes – some Ks, some long balls.
Walks: Unfavorable. In such a homer-prone park, pitchers often try to avoid giving in. It’s not unusual to see hurlers nibble at the edges rather than challenge a slugger in this bandbox, which leads to more walks. Cincinnati has consistently been among the higher walk rate parks; Reds pitchers at home issue free passes at a slightly elevated clip as they cautiously navigate dangerous situations.
Earned Runs: Very unfavorable. Great American Ball Park is extreme for scoring. It’s arguably second only to Coors Field in hitter-friendliness. With shallow fences (especially in right-center and down the lines) and summer humidity, it posted HR park factors as high as 1.38 recently. That means tons of homers and runs. Pitchers’ ERAs balloon at GABP – even average fly balls can become 2-run homers. Betting overs on runs in Cincinnati is popular for a reason. It’s a park where a pitcher needs to keep the ball on the ground or face the consequences.
Outs Recorded: Unfavorable. The likelihood of crooked-number innings is high, so starters often get an early hook. It’s tough for a pitcher to last 6+ innings without the Reds or the opponent lighting up the scoreboard. Managers tend to have a quick trigger in this park because a game can get out of hand fast. Thus, pitchers usually don’t accumulate as many outs; expect shorter outings on average in Cincinnati.
American Family Field (Milwaukee Brewers): A hitter-friendly park for power, but with a controlled environment (retractable roof) that also yields high strikeouts.
Strikeouts: Favorable. Milwaukee’s park surprisingly boosts strikeouts quite a bit. It consistently showed one of the highest strikeout environments (Statcast had it #2 behind only Tropicana over 2021-23). Fastball whiffs are high here (23.3% whiff rate, top 3). The roof and background likely help pitchers; also Brewers hitters historically have been free-swingers, but the park factor suggests an inherent edge as well. So, strikeout props get a boost in Milwaukee – pitchers often fan more batters at home.
Walks: Neutral. Miller Park (AmFam Field) used to be known as a homer haven, which might cause caution, but the effect on walks isn’t pronounced. Brewers pitchers generally have average walk numbers at home. They do attack with strikeouts, which can lead to a few walks if batters don’t chase, but nothing out of the ordinary stands out.
Earned Runs: Unfavorable. This park is hitter-friendly for scoring. It’s not as extreme as Cincinnati or Coors, but it consistently inflates run scoring (typically top 10 in run factors). The closed roof keeps the air warm and lively, and the dimensions aren’t large. Pitchers give up more homers and extra-base hits here. Expect ERAs to be higher at home for Brewers pitchers – a decent jump in runs allowed versus a neutral park.
Outs Recorded: Neutral to slightly unfavorable. The high strikeouts can allow a dominant pitcher to still go deep (lots of Ks can offset the hits – e.g., Corbin Burnes might strike out 12 and go 7 innings despite 2 homers allowed). However, for most pitchers, the increased runs and high pitch counts (from both Ks and hits) mean somewhat shorter outings. So while the K boost helps pitchers last by getting outs themselves, the extra offense can shorten the leash. Overall, it’s a wash or a bit on the shorter side for outings.
PNC Park (Pittsburgh Pirates): A pitcher-friendly park with deep left-center field and a reputation for suppressing power.
Strikeouts: Unfavorable. Pittsburgh doesn’t help much with Ks; in fact it’s among the lower strikeout environments. It had a low fastball whiff rate (~17.3%, bottom 5)pitcherlist.com. The batter’s eye (Pittsburgh’s skyline beyond center, though there is a backdrop) seems fine for hitters, and the park encourages contact – pitchers often pitch to contact here given the big field. So strikeout totals are a bit lower in PNC.
Walks: Favorable. Because it’s hard to hit one out to left or center, pitchers challenge hitters aggressively. Walk rates tend to be lower in Pittsburgh. Pirates pitchers historically walk fewer at home, trusting the park to hold most hard contact. Opposing pitchers often do the same. So, props for walks allowed lean under at PNC.
Earned Runs: Favorable. PNC Park suppresses runs. It’s known for being tough on right-handed power (a 410+ ft gap in left-center) and generally a big field. While lefties can poke some out over the Clemente Wall, overall run scoring is below average. Pitchers benefit with lower ERAs at home thanks to fewer homers and a lot of fly balls turning into outs near the notch. It’s not the absolute most suppressing park, but definitely pitcher-friendly.
Outs Recorded: Favorable. Pitchers can often go deeper into games at PNC because they aren’t getting shelled as often. Fewer extra-base hits allow for manageable innings. A pitch-to-contact guy can thrive here and get quick outs, and even strikeout pitchers aren’t at a disadvantage. As a result, Pittsburgh sees its share of deep outings (complete game bids are not unheard of on a good night). It’s a good park for overs on outs, given a competent starter.
Busch Stadium (St. Louis Cardinals): A spacious park that leans pitcher-friendly, especially in power suppression.
Strikeouts: Unfavorable. Busch doesn’t yield many extra Ks. It actually was tied among the lowest in fastball whiffs (17.3%). The expansive outfield means pitchers don’t have to go for strikeouts; they can let hitters put it in play. Also, St. Louis typically has good batter’s eye and hitters see the ball decently. So strikeout props might underperform slightly at Busch.
Walks: Favorable. Cardinals pitchers, known for pitching to contact, walk very few at home – partly a staff philosophy, partly park confidence. In general, Busch being a pitcher’s park means hurlers throw strikes. Walk rates are lower than average here. It’s a good spot for a pitcher to pound the zone and trust his defense (and many do).
Earned Runs: Favorable. Busch Stadium tends to suppress run scoring. It’s not extreme, but solidly pitcher-friendly (often 3-5% fewer runs than average). Homers are tough to hit out (especially in the alleys), and the park plays big in the summer humidity. St. Louis appears in the bottom tier of home run factors and has been kinder to pitchers, evidenced by many Cardinals starters having better numbers at home. Look for slightly lower ERAs at Busch.
Outs Recorded: Favorable. With fewer runs allowed and efficient pitching, starters often last longer. St. Louis managers also historically let their guys work deep if they’re effective. Busch Stadium’s conditions allow even pitch-to-contact arms to survive 7+ innings on a good night (low walks, low homers mean low stress innings). So, it’s generally a plus for outs recorded.
NL West
Chase Field (Arizona Diamondbacks): Once a launching pad, the introduction of a humidor and a more frequently closed roof have moderated Chase Field’s offense, though it’s still fairly hitter-friendly.
Strikeouts: Unfavorable. Arizona tends to suppress strikeouts. It was among the lowest in strikeout environment: fastball whiff rate ~17.2% (bottom tier). The dry air (when roof is open) and a backdrop that hitters seem comfortable with lead to more contact. Also, movement on pitches is a bit less in the desert. Pitchers get fewer Ks in Chase than their stuff might get elsewhere.
Walks: Neutral. This one is balanced. While fewer Ks could imply more balls in play and possibly fewer walks (as pitchers are around the zone), the fear of extra-base hits in the gap could also cause some caution. These influences roughly cancel out. Walk rates at Chase Field are near average.
Earned Runs: Neutral to slightly unfavorable. Chase Field historically was very hitter-friendly, but the humidor installation a few years back and closing the roof more often curbed the extreme offense. Now it’s closer to middle-of-pack. Still, it hasn’t become pitcher-friendly – it remains a place where offense can thrive with a park factor a bit over 1 for runs in many seasons. So pitchers might still allow a bit more than their norm. For example, breaking balls don’t bite as hard in the dry air, making it easier for hitters to square them (contributing to runs). Overall, expect somewhat elevated ERAs in Arizona, but not as high as Coors or Cincy level.
Outs Recorded: Neutral. With offense only moderately higher, Diamondbacks starters can go deep if pitching well, or get knocked out if not – much like in a neutral park. There’s no strong park factor pushing early exits consistently. One consideration: when the roof is open on a hot day, fatigue can set in, possibly shortening outings. But on the flip side, the roof is usually closed during extreme heat, maintaining consistency. So, assume average outing lengths.
Coors Field (Colorado Rockies): The most infamous hitter’s park. High altitude (one mile high) radically affects pitching – less air resistance, less pitch movement, huge outfield gaps.
Strikeouts: Very unfavorable. Coors is the hardest place to strike hitters out. The thin air reduces pitch movement (breaking balls don’t break as much, fastballs have less life), so hitters make more contact. Coors had the lowest strikeout park factor in MLB over recent years (whiff rate only ~16.5% on fastballs). It suppresses Ks around 12–13% compared to average (an NL-high reduction). Pitchers who rely on spin see their K numbers plummet in Denver. Expect significantly fewer strikeouts – a big red flag for strikeout props (unders are common for visiting aces at Coors).
Walks: Unfavorable. Pitching at altitude is tricky, and many pitchers nibble because their stuff is less effective. They also tire quicker. The result can be more walks. Additionally, with breaking balls not gripping, pitchers throw more non-competitive pitches or fall behind in counts, issuing walks. Rockies games often feature plenty of free passes adding to the chaos. (Some Rockies pitchers take the opposite approach and throw strikes to avoid big innings via walks, but even then, fear of the big hit can lead to more base on balls overall).
Earned Runs: Very unfavorable. Coors Field is off the charts for run scoring. It boosts runs roughly 25%+ above average in some years. Even with a humidor, it remains the top run-scoring environment in MLB. Homers fly out due to reduced air density, and the expansive outfield (built to offset the homers) means any ball that doesn’t leave often finds a gap for a double or triple. Pitchers’ ERAs skyrocket; a “good” start at Coors might be 5-6 innings, 3-4 runs. Bettors almost always lean over on earned run props for pitchers in Denver – it’s simply hard to put up zeros in this park.
Outs Recorded: Unfavorable. Long innings and high pitch counts are common, so pitchers rarely last deep. Managers often have a quick hook at Coors to prevent a bad inning from getting worse. Complete games are virtually nonexistent, and even 7-inning outings are rare feats. Most starters are gassed by the 5th or 6th due to the workload (and altitude fatigue). So, unders on outs recorded are usually a safe play in Colorado.
Dodger Stadium (Los Angeles Dodgers): A historically pitcher-friendly park, especially at night when the air is heavy. Fairly standard dimensions, with a slight bias against offense.
Strikeouts: Favorable. Dodger Stadium has shown an above-average strikeout environment, particularly on breaking pitches (33.0% whiff rate on breakers, top 5). The venue seems to help sharp breaking balls drop (perhaps the dry air + sea-level altitude combination). Dodger pitchers (who are good to begin with) tend to pile up Ks at Chavez Ravine. So do many visitors. Overall K factor leans pitcher-friendly.
Walks: Neutral. No strong evidence of altering walk rates. Dodgers pitchers are typically around average in walks at home. The park’s slight run suppression might encourage challenging hitters (lowering walks), but also the Dodgers face many tough lineups who will take walks if offered. It balances out.
Earned Runs: Favorable. Dodger Stadium suppresses runs moderately. It’s especially kind in night games – the marine layer from the nearby Pacific cools the air and knocks down fly balls. It’s not impossible to score (day games or Santa Ana winds can allow offense), but generally it’s a pitcher’s park. Home runs to center and right-center are tough. Statistically, it’s often in the lower third of parks for offense. Pitchers usually post better ERAs at home as a result.
Outs Recorded: Favorable. Dodger Stadium’s run-suppressing nature and expansive foul ground (especially near the foul poles) help pitchers go deeper. LA managers also tend to let their starters go a bit longer at home if they’re in control, because the environment is less risky for the bullpen. We frequently see Dodger starters complete 6-7 innings, keeping their pitch counts reasonable thanks to the park aiding quick outs.
Petco Park (San Diego Padres): Petco has a strong pitcher-friendly reputation, especially in the evenings when dense air from the ocean comes in. Even after fence adjustments over the years, it remains tough on hitters.
Strikeouts: Neutral. Petco doesn’t significantly boost strikeouts; it mainly suppresses hits. Pitchers get average K numbers here. The marine layer makes hard contact die (helpful for ERA) but doesn’t necessarily cause more swings and misses than usual. Padres pitchers’ strikeout rates are largely similar home vs away. So, no major prop edge on Ks.
Walks: Favorable. Given the big dimensions and low scoring, pitchers confidently throw strikes at Petco. Walks are on the lower side. There’s less penalty for a mistake pitch, so fewer four-pitch walks or careful pitching. Padres games at home often feature fewer combined walks than the league average.
Earned Runs: Very favorable. Petco Park is consistently near the top of pitcher’s parks for run suppression. In 2024 it was the lowest run-scoring park in MLB until Seattle overtook it, and it remains in the bottom few entering 2025. It can cut scoring by >10%. Homers in San Diego’s night air are hard to come by, and the park’s power alleys are not easy to reach. Pitchers flourish – it’s common to see low-scoring duels. If you’re looking at an earned runs prop, unders at Petco are usually enticing unless two ace offenses are involved.
Outs Recorded: Favorable. Because runs are scarce, starters can often work deeper into games. They face fewer high-stress, long innings. It’s a park where a decent pitcher can go 7 innings with an efficient pitch count. The only caveat: the Padres often employ quick hooks due to strategic bullpen usage, but that’s not park-driven. Park-wise, it’s helping pitchers last longer.
Oracle Park (San Francisco Giants): A pitcher’s haven, especially before recent minor fence moves. Known for swirling winds and dense air knocking balls down – particularly brutal for power hitters (and friendly to pitchers’ stats).
Strikeouts: Neutral. San Francisco’s impact is more on contact quality than strikeout frequency. It doesn’t greatly enhance Ks; hitters still put bat to ball, but the park then takes care of the rest. That said, the challenging hitting environment can lead to some extra chases – overall K rate is roughly average here.
Walks: Favorable. With Oracle’s reputation for swallowing fly balls, pitchers aggressively go after hitters. Walk rates are generally a bit lower. Also, the often cool, breezy conditions can make control slightly tougher for pitchers, but they compensate by not being afraid of contact. The net effect has been slightly fewer walks than average in San Francisco.
Earned Runs: Very favorable. Oracle Park is one of the most run-suppressing stadiums. Even after moving the CF wall in a few years ago, it’s tough on offense. Overall run factor hangs around 0.93 or lower. The thick Bay Air and almost nightly winds blowing in from right field “eat baseballs alive”, drastically reducing home runs. Right-handed hitters especially see big park effects (San Francisco for years had the lowest HR park factor for righties). Pitchers love it – many fringe pitchers have found success in Giants uniforms thanks in part to Oracle Park limiting hard-hit damage. Expect significantly lower ERAs at home for Giants pitchers and anyone pitching in this park.
Outs Recorded: Favorable. Everything about Oracle Park supports longer outings: fewer runs, lots of foul territory for bonus outs, and a pitcher-friendly climate. Giants starters and opponents alike often pitch deeper into games at Oracle. Unless pitch count gets high, managers know the park will help protect a tired pitcher to an extent (a fly ball that might be a homer elsewhere becomes the third out in San Francisco). This is a good park to back an over on outs recorded for competent starters.
Impact of Wind on Pitching Props
Weather, especially wind, can significantly alter pitcher performance in certain stadiums. Wind affects the flight of the ball and sometimes a pitcher’s control. Here’s how wind direction and strength generally influence the four prop categories:
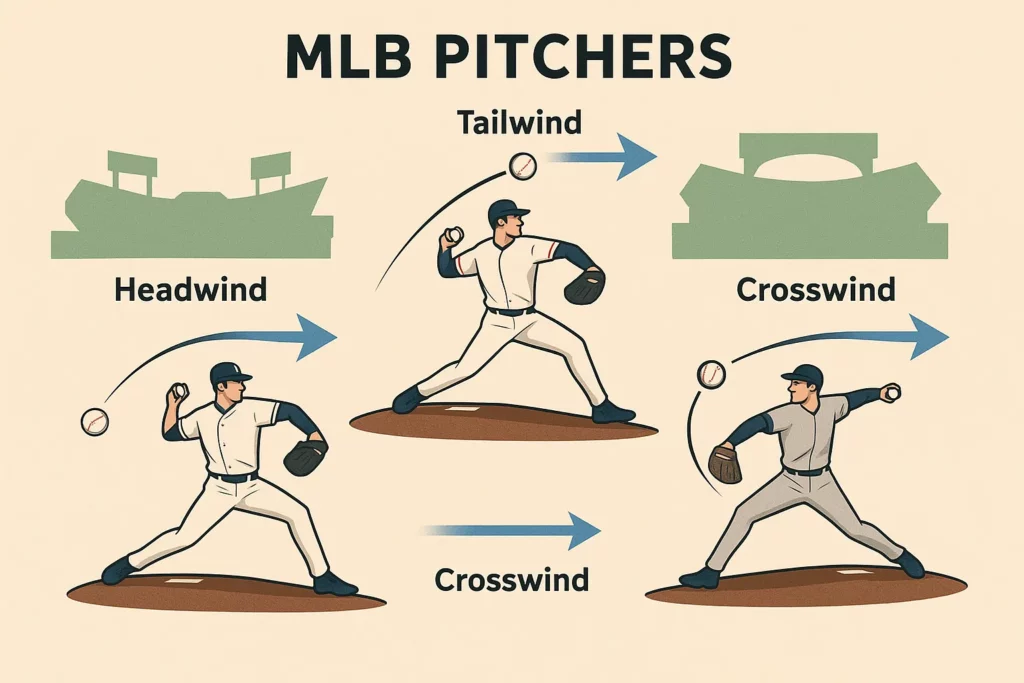
Strikeouts: Moderate wind can slightly affect strikeouts. A strong crosswind (blowing across the field) can make it harder for pitchers to locate pitches and for batters to make contact. Studies show a 10 mph crosswind can decrease strikeout rate by about 0.15 (i.e. 0.15 fewer Ks per 9) – a subtle drop. When wind is blowing out (from home plate out to the field), pitchers might pitch to contact more (trusting the wind to knock a ball down if it’s blowing in, or trying to keep it down if blowing out). If wind out makes hitters more aggressive, it could slightly decrease strikeouts (balls put in play earlier). Conversely, a stiff wind blowing in can give pitchers extra confidence to challenge hitters, possibly leading to more strikeouts (since even hard contact might stay in the park, pitchers go for Ks without fear). Overall, wind isn’t a primary driver of Ks, but extreme winds (like at Wrigley) can change approach: e.g. on a wind-in day, a power hitter might struggle and strike out more.
Walks Allowed: Wind can have a noticeable effect on walks. Pitchers adjust their approach with wind:
With a strong wind blowing out, especially in homer-friendly parks, pitchers may nibble at the corners more to avoid giving up a wind-aided bomb. This often increases walks allowed. They’d rather issue a free pass than groove one that could sail out. Also, breaking pitches move less into a wind, affecting command. On windy days at places like Wrigley (wind out), we often see more walks as pitchers hesitate to throw anything hittable.
With wind blowing in, pitchers are more aggressive – they trust that even well-hit balls will die. They challenge hitters in the zone, which tends to reduce walks. For example, at Wrigley when the wind is howling in, pitchers attack and walk fewer batters, knowing the park will help bail them out if contact is made.
Crosswinds can also mess with a pitcher’s control, leading to more misses off the plate. A gusty crosswind has been noted to slightly raise ERA and likely walk rate as well. In general, windy conditions add variability – but a safe rule: wind out = more cautious pitching (higher walks), wind in = confident pitching (lower walks).
Earned Runs: Wind is a major factor for runs:
Wind blowing out to the outfield (especially to left or right field corners) greatly benefits hitters and increases runs. When the wind is helping carry the ball, fly balls turn into extra-base hits or homers. In fact, MLB data indicates teams score ~5.8% more runs when wind blows out to left (the most favorable direction for predominantly right-handed lineups). At extreme levels (15+ mph out to left), home runs can spike by ~10%. For pitchers, this means a higher likelihood of giving up runs. Even routine fly balls might get pushed over the fence. Parks like Wrigley Field are notorious: a 15 mph wind out can transform a 3.00 ERA pitcher into a batting practice thrower for the day. In such games, earned run props for pitchers often soar over – it’s tough to keep runs down when Mother Nature is against you.
Wind blowing in from the outfield helps pitchers and suppresses runs. A strong wind in turns would-be homers into warning track outs. Teams often score less in these conditions. At Coors Field, for example, winds blowing in from center have corresponded with the lowest scoring games (around 10.4 total runs vs 12+ with wind out). For a pitcher, a wind blowing in can be like an extra fielder. It allows more margin for error on fly balls. Pitchers tend to have better outcomes (lower ER) on wind-in days – we often see unders hit for runs in those games. However, note that wind in doesn’t automatically shut down offense; if it’s weak or swirling, impact may be minor. But a stiff breeze coming in is generally pitcher-friendly.
Crosswinds can go either way for runs, but often they slightly favor offense by messing with pitch movement and fielder judgment. A crosswind might take a drifting fly ball away from a fielder or carry a gapper a bit further from an outfielder’s reach, leading to extra hits. It also may reduce the sharpness of breaking pitches (increasing solid contact). The OddsTrader data suggested a crosswind can raise ERA by ~0.15 (small but real). So while not as impactful as in/out winds, crosswinds typically hurt pitchers’ run prevention a touch.
Outs Recorded: Wind influences how long a pitcher lasts indirectly via the runs and stress on pitch count:
When wind is helping hitters (outward), pitchers give up more hits and runs, which often means shorter outings (fewer outs recorded). Managers won’t leave a pitcher in to be shelled by gale-force aided shots. For instance, a Cubs starter might only go 4 innings on a windy-out day after giving up 6 runs, whereas that same pitcher might go 7 innings with wind in. So wind-out games are detrimental for outs recorded props.
In contrast, wind-in conditions can lead to longer outings. Pitchers cruise more easily when the ball isn’t traveling. They can challenge hitters and get quick outs, and even if a few men reach, the wind might save them from a big inning. This means managers can let them pitch deeper. It’s not uncommon to see a pitcher steal an extra inning of work thanks to a forgiving wind blowing in (low pitch count, confidence up). Thus, strong wind in can be beneficial for outs recorded (pitchers going over their usual outs).
Again, Wrigley Field exemplifies this: on a windy-in day, a decent pitcher can throw a complete game shutout with a low pitch count; on a wind-out day, even an ace might be yanked by the 5th.
Crosswinds don’t usually affect outs recorded as much as in/out winds. They might marginally shorten outings if they lead to more walks or a few extra hits (pitchers laboring more). But it’s a secondary effect.
Notable Stadiums & Wind: A few parks deserve special mention:
Wrigley Field (Cubs) – the wind temple. No stadium’s pitching props fluctuate with wind as much. Wind out (to any field) in Wrigley can turn a game into a slugfest; pitchers see fewer Ks, more walks, high ER, and low outs (often a day to fade pitcher props). Wind in from center or right makes it a pitchers’ day; expect better stats across the board for pitchers. Always check the forecast here.
Oracle Park (Giants) – known for a consistent wind blowing in from right field off the bay in the evenings. This prevailing wind heavily favors pitchers, knocking down fly balls to right (bad for lefty pull hitters). It helps keep runs low and can extend pitcher outings. The effect on Ks is minimal, but fewer runs means potentially more outs for pitchers. Giants pitchers often leverage this, and visiting pitchers benefit too from the predictable breeze.
Dodger Stadium (Dodgers) – usually calm, but occasionally Santa Ana winds can blow out to center in daytime, which would bump up offense. At night, a gentle breeze blows in from center as the air cools – assisting pitchers (as reflected in Dodger Stadium’s night games being low-scoring). Pitchers usually perform better in the typical night breeze (lower runs, maybe go deeper).
Coors Field (Rockies) – surprisingly, wind is less a factor because altitude dominates. Still, if wind is blowing out on top of the thin air, it’s a nightmare for pitchers. Conversely, a rare strong wind in might slightly mitigate Coors’ offense. But overall, focus on altitude here; wind is icing on the cake (usually not enough to save a pitcher from trouble, but can make a bad situation even worse).
Kansas City’s Kauffman Stadium – generally open and can have wind, but its impact is less talked about. A wind blowing in might help a bit, but Kauffman’s issues (huge field = hits) aren’t fixed by wind unless it’s a gale. Wind out could carry a rare homer, but again, homers aren’t the main source of runs there. So wind isn’t as critical for Kauffman pitcher props as the park’s innate contact-friendly nature.
Open Roof in Retractable Parks – When parks like Toronto, Arizona, Seattle, Texas open the roof, wind can play a role. Usually, if wind would be a major issue (strong or adverse), they keep it closed. But if open:
Toronto can get some breeze from Lake Ontario that might blow in – could help pitchers a bit on those days.
Arizona has less wind influence (stadium design blocks some, and often it’s just hot and still).
Seattle rarely leaves roof open in rain/wind; if it’s open, conditions are usually mild. Wind isn’t a huge factor there compared to the heavy air.
Miami almost always closes roof for weather, so wind is negligible there.
Milwaukee likewise – wind is minimal when closed; open days might see some breeze, but generally Miller Park is shielded.
In summary, wind blowing out = bad for pitchers (more runs, fewer outs, possibly fewer Ks but more walks), and wind blowing in = good for pitchers (fewer runs, more outs, slightly more Ks, fewer walks). Always consider the orientation: wind to left field tends to boost offense the most (helping pulled fly balls), while wind to right can oddly hurt righty hitters by pushing their pulled flies toward deeper center, which can actually help pitchers. Each stadium’s orientation means a “wind out” could be to dead center (like in Detroit or KC) or to a corner. But the general principles hold.
The biggest takeaway: extreme wind conditions can override a park’s usual behavior. A normally pitcher-friendly park (say, San Diego) can play offensive if a rare Santa Ana-like wind blows out hard. Conversely, a bandbox (like Philly) can play big if a cold wind blows in. Savvy bettors and analysts always integrate wind forecasts for parks like Wrigley, and pitchers’ prop lines often adjust accordingly (sometimes dramatically in Wrigley’s case). In moderate wind scenarios, expect minor tweaks: a slight breeze won’t drastically change things, but strong winds absolutely will.